 01 Input
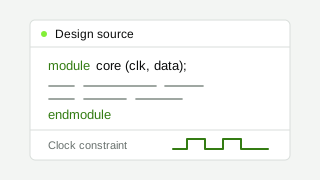
RTL + SDC
Design intent
01 Input
RTL + SDC
Design intent
01 / METHODOLOGY
RTL-to-GDS evaluation.
FluxBench evaluates each agent through the same standardized RTL-to-GDS flow, covering synthesis, physical design, timing closure, ECO, and final GDS validation.
01 Input
RTL + SDC
Design intent
 02 DC
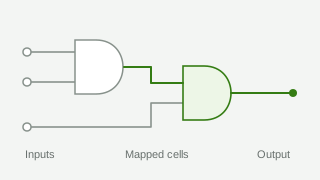
Logic synthesis
Mapped netlist
02 DC
Logic synthesis
Mapped netlist
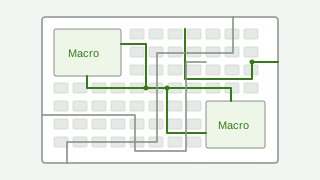 03 P&R
Physical design
Place / CTS / Route
03 P&R
Physical design
Place / CTS / Route
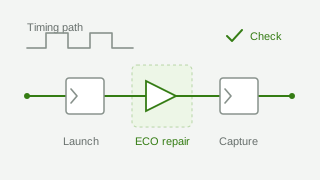 04 PT
Timing + ECO
Close violations
04 PT
Timing + ECO
Close violations
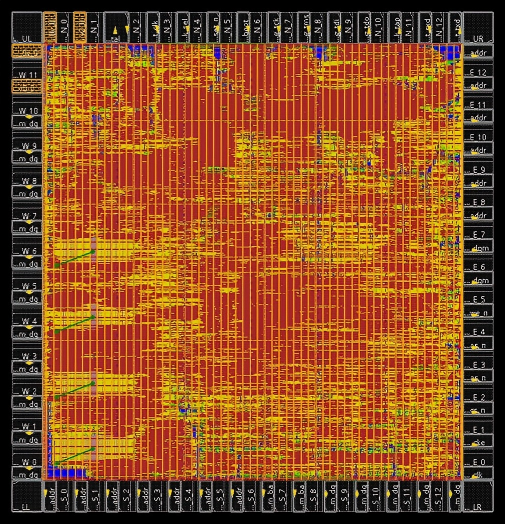 05 Signoff
Final evidence
Artifact acceptance
05 Signoff
Final evidence
Artifact acceptance
02 / RANKING
Performance ranking
Score measures implementation quality. ROI balances Score against normalized cost and runtime.
Loading dataset...
Score comparison
Swipe horizontally to compare more. Exact values are shown above each bar. All results remain available below.
Detailed results
Full rankings, configurations, and implementation metrics.
Loading benchmark data
03 / SCORING
Evaluation metrics
The RTL-to-GDS score combines sequential flow completion with the quality of the final implementation.
Protocol reference / paperS = 0.2 Sstage + 0.8 Sresult
20% process completion and 80% final implementation quality.Sstage = (GL + GPR + GECO) / 3
Logic synthesis, place-and-route, and ECO are sequential gates. A later gate contributes only after every preceding gate fully passes.Sraw = 1/6 Σm ∈ M Sm
M = {area, setup WNS, setup TNS, hold WNS, hold TNS, power}. The Result Score is zero unless all process gates pass.Ssmall(x; b) = 100b / x
Smaller is better. Values at or below the frequency-specific reference best receive 100; invalid values receive zero.- 350 MHz
- 23,746.27 µm² / 2.49435 mW
- 700 MHz
- 34,291.88 µm² / 6.92488 mW
Stiming(x; L) = 100(x - L) / (-L)
Larger is better. Non-negative timing receives 100; values at or below the negative floor receive zero.- Setup
- WNS -0.80 / TNS -200.0
- Hold
- WNS -0.30 / TNS -80.0